Luxor, Egypt · Choose booking dates on the provider’s site.We may earn a commission on Booking.com or Viator bookings. Weather rankings are independent.
Santiago, Chile · Choose booking dates on the provider’s site.We may earn a commission on Booking.com or Viator bookings. Weather rankings are independent.
Swakopmund, Namibia · Choose booking dates on the provider’s site.We may earn a commission on Booking.com or Viator bookings. Weather rankings are independent.
Jaipur, India · Choose booking dates on the provider’s site.We may earn a commission on Booking.com or Viator bookings. Weather rankings are independent.
Oaxaca, Mexico · Choose booking dates on the provider’s site.We may earn a commission on Booking.com or Viator bookings. Weather rankings are independent.
Closest matches among our curated places, even when none fits perfectly. Rainfall is a monthly amount, not a count of rainy days. Open the map to compare exact dates.
How the weather-fit scores work
Default weather fit out of 100, using preferred daytime highs of 68–81°F (20–27°C), less rainfall, and no overnight minimum. Temperature contributes 65% of the starting score and rainfall 35%; severe mismatches reduce it further. An overnight minimum also reduces scores where nights are too cold. Adjust your preferences above to make the score yours; your preferences follow you to the map.
Estimates cover January 1–31 using 1991–2020 historical climate averages. Exact trip dates can produce different results. High scores do not promise sunshine.
More January inspiration
Compare warmer days in Lima and Muscat with cooler nights in Jaipur and Antigua Guatemala. January gives these six places very different day-to-night balances. These stories stay here as your personalized picks above change. Photos illustrate the destinations, not expected January conditions.
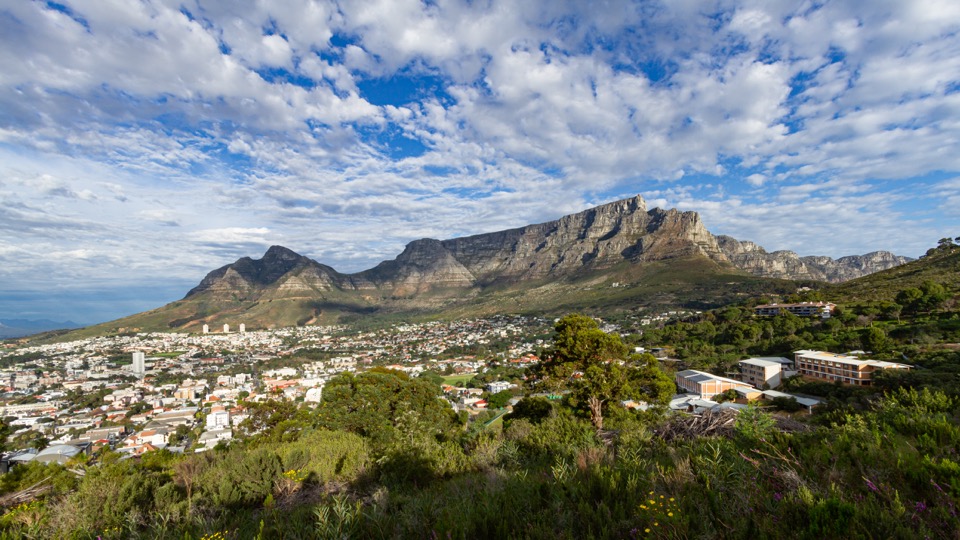
Cape Town, South Africa · Choose booking dates on the provider’s site.We may earn a commission on Booking.com or Viator bookings. Weather rankings are independent.
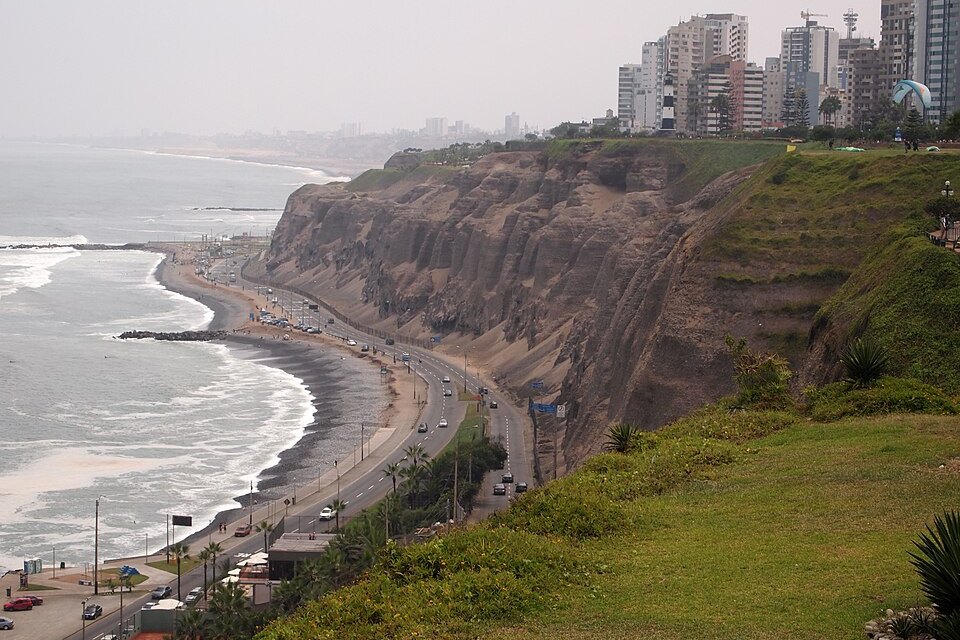
Spend time in Lima’s historic center, where plazas and architecture make the capital more than a connecting flight. Use it as the starting point for a city visit at your own pace.
Why January? January brings warmer daytime averages than July. Average rainfall amounts are similar across the two months.
January averages: 80°F high · 66°F low, with 0.0 inches of rainfall over the month. For comparison, the average high in July is 66°F.
Tradeoff: Low rainfall does not promise sunshine. Cloud, wind and water temperature are outside this score.
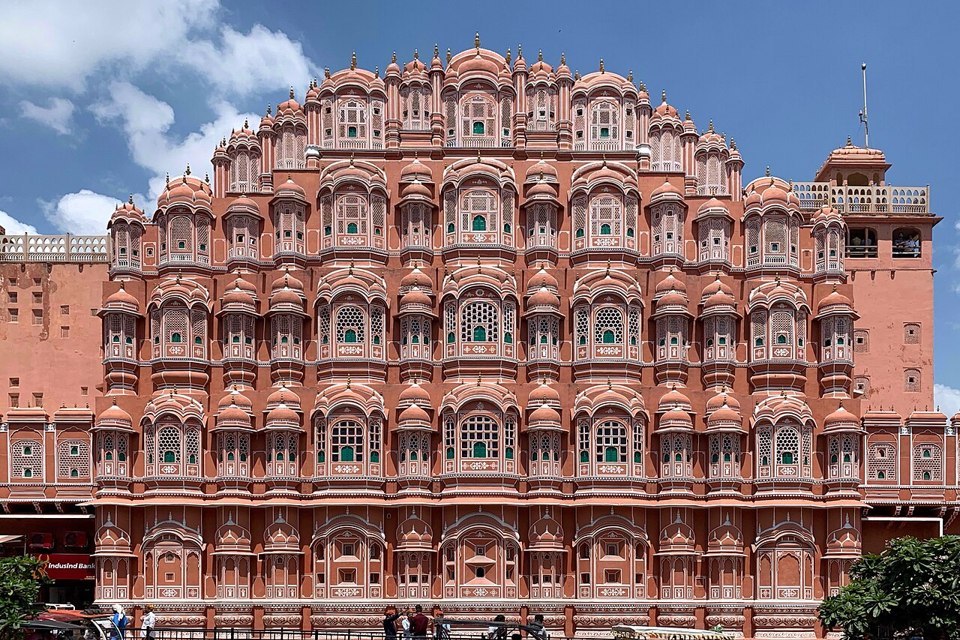
Start with Hawa Mahal’s intricate facade and make time for the City Palace. Jaipur offers a city break built around architecture, with details worth noticing between its better-known landmarks.
Why January? January offers cooler daytime averages than July. Typical daily rainfall is lower.
January averages: 75°F high · 48°F low, with 0.2 inches of rainfall over the month. For comparison, the average high in July is 95°F.
Tradeoff: Nights are chilly on average; add an overnight minimum if that would affect your trip. Low rainfall does not promise sunshine. Cloud, wind and water temperature are outside this score.
Jaipur, India · Choose booking dates on the provider’s site.We may earn a commission on Booking.com or Viator bookings. Weather rankings are independent.
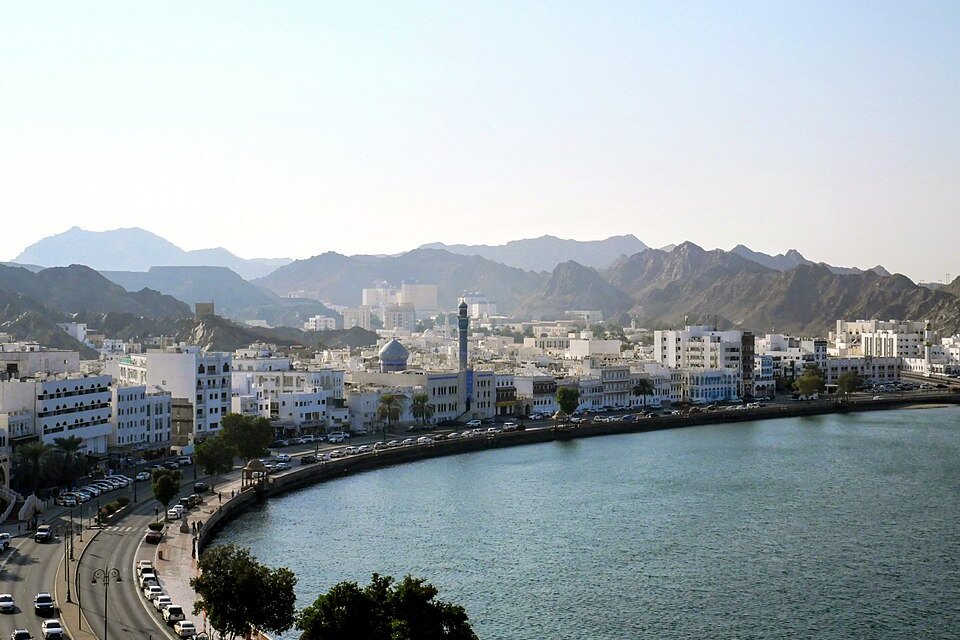
Spend time around Muttrah’s corniche and souq, with the harbor and hills giving the district its setting. Muscat offers a coastal city experience to consider alongside any wider Oman itinerary.
Why January? January offers cooler daytime averages than July. Typical daily rainfall is higher, so keep some flexibility in outdoor plans.
January averages: 79°F high · 64°F low, with 0.6 inches of rainfall over the month. For comparison, the average high in July is 102°F.
Tradeoff: Low rainfall does not promise sunshine. Cloud, wind and water temperature are outside this score.
Muscat, Oman · Choose booking dates on the provider’s site.We may earn a commission on Booking.com or Viator bookings. Weather rankings are independent.
Explore Antigua’s cobbled streets, plazas and surviving colonial buildings. Its churches and ruins make the city itself a reason to linger, rather than just a stop on the way elsewhere.
Why January? Daytime averages in January are fairly close to July. Typical daily rainfall is lower.
January averages: 74°F high · 52°F low, with 0.6 inches of rainfall over the month. For comparison, the average high in July is 75°F.
Tradeoff: Low rainfall does not promise sunshine. Cloud, wind and water temperature are outside this score.
Antigua Guatemala, Guatemala · Choose booking dates on the provider’s site.We may earn a commission on Booking.com or Viator bookings. Weather rankings are independent.
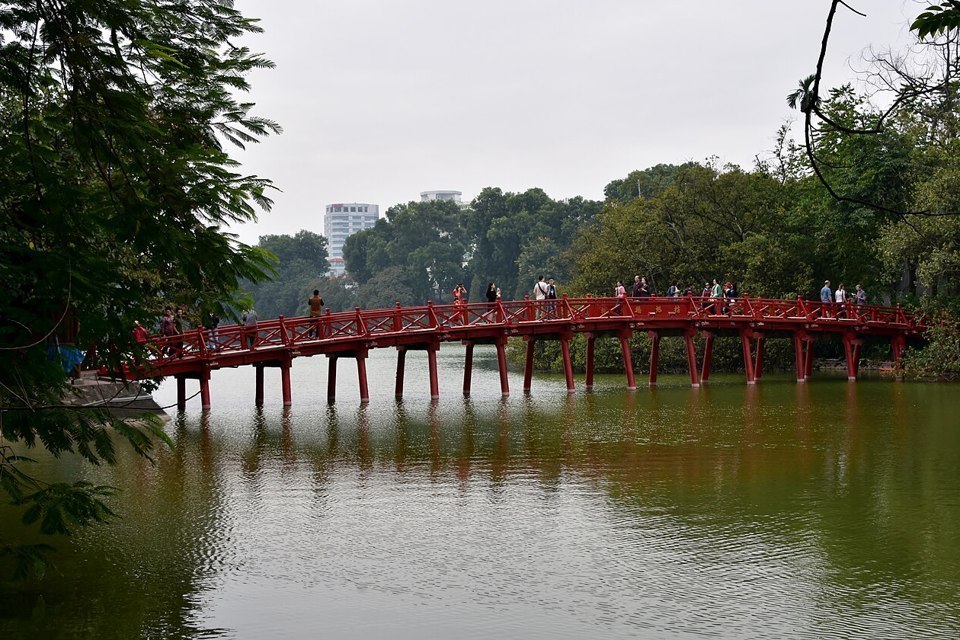
Use Hoan Kiem Lake as a starting point for exploring Hanoi’s Old Quarter. The trading streets, food stops and nearby historic sights offer plenty to build a city visit around.
Why January? January offers cooler daytime averages than July. Typical daily rainfall is lower.
January averages: 69°F high · 60°F low, with 1.0 inches of rainfall over the month. For comparison, the average high in July is 92°F.
Tradeoff: Low rainfall does not promise sunshine. Cloud, wind and water temperature are outside this score.
Hanoi, Vietnam · Choose booking dates on the provider’s site.We may earn a commission on Booking.com or Viator bookings. Weather rankings are independent.
Make it your January
Prefer cooler days? Need comfortable nights? Open a destination on the map and add places to your comparison. Each link opens the next upcoming January—or the current January if you are reading during that month—with your weather preferences carried over. You can then pick your exact dates.
The six personalized picks come from 201 curated destinations, using the same weather-fit calculation as our map. Your preferred highs, rainfall amounts and optional overnight minimum shape the results. We include geographic variety among similar scores; these are matches to explore, not a ranking of every place in the world.
The six illustrated stories are editorial starting points chosen to show different January climates and travel experiences. They stay the same when you adjust your preferences. Booking commissions do not affect scores or selections. More about Seasonward and how we make our guides.
Where the numbers come from
Recommendations use the same climate sources as the map: a 0.5° CRU grid (approximately 55 km north–south), with local station data where available. The six inspiration destinations use the CRU grid. Monthly high, low and precipitation values are interpolated to each day, then averaged or totalled across January. The numbers describe typical regional conditions, rather than the weather at a particular hotel or trail.
Mountains, coasts and neighborhoods can differ substantially from their regional estimate. Historical averages are not extremes or predictions. Sunshine, humidity, wind and water temperature are not included. Small score differences should not decide a trip on their own.
Destination descriptions draw on tourism boards, heritage organizations and attraction websites. Sources below also cover places that may appear when you adjust your preferences. Photographs illustrate the places, not the conditions to expect for your dates. Each image is linked to its source and license above; resized or cropped versions retain that license.
 seasonwardExplore the map ↗